Condition monitoring
Hear about the problem days before the breakdown.
MaintenanceIQ condition monitoring checks every reading from your PLCs, SCADA, IoT gateways and manual rounds against the limits you set, and shows when a machine is drifting toward trouble. It helps your planner and reliability engineer fix the problem in a planned stop instead of an emergency.
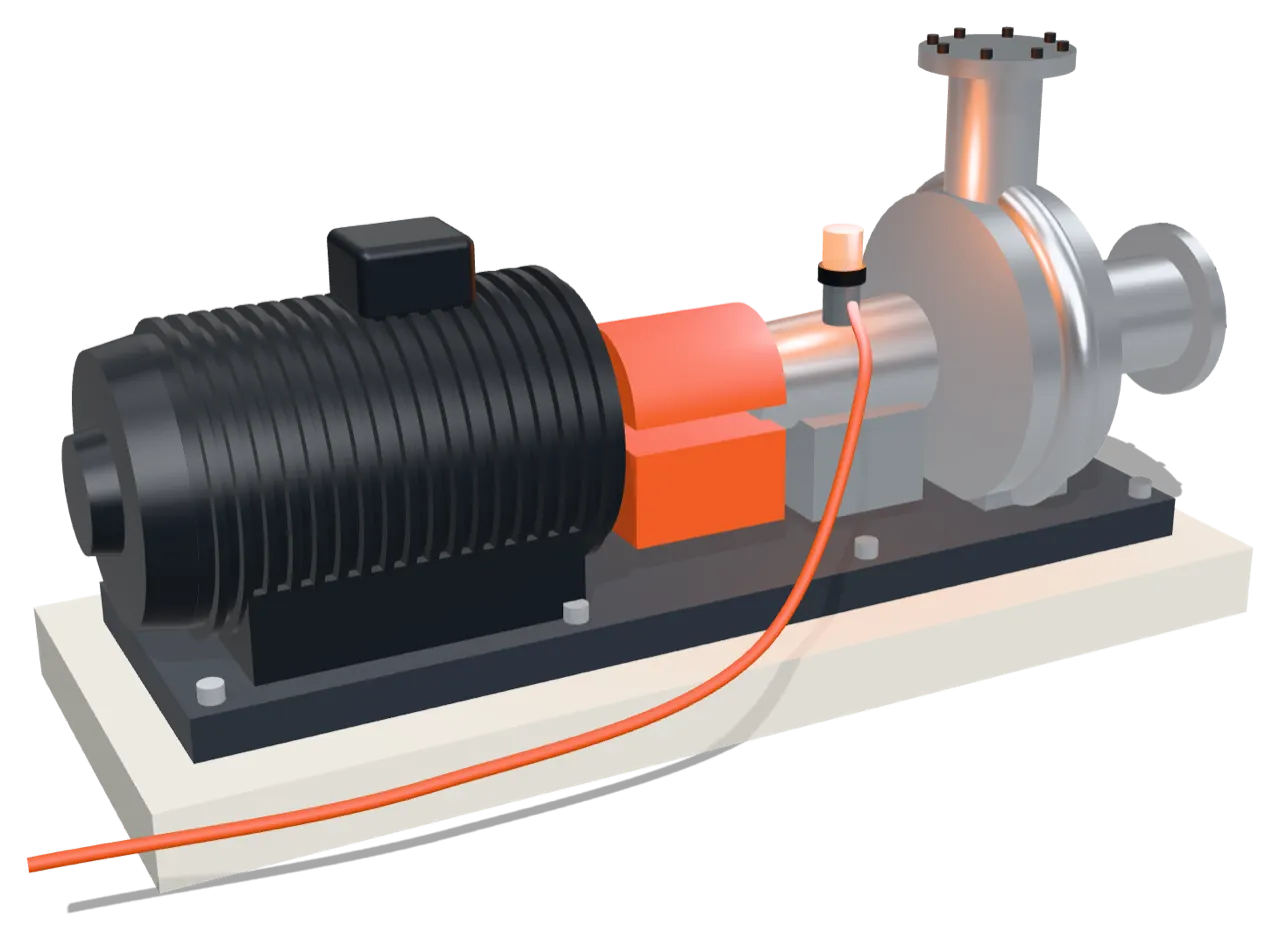
09:30 · Early warning · Illustrative
A pump that tells you it is getting worse.
An illustrative morning. The bearing on pump P-07 vibrates a little more each day. Nothing has failed. Nobody on the floor has noticed. The readings arrive from the plant's gateway every few minutes, and from the operator's round once a shift.
At 09:30 a reading crosses the warning limit your team set for that bearing. MaintenanceIQ classifies it the moment it arrives, alerts the people who look after P-07, and shows on the asset's Monitoring tab when the trend is likely to reach the critical limit at its current rate. Your planner books the bearing change into Thursday's planned stop. The line keeps running.
P-07 and its readings are illustrative. The way each reading is checked, trended and acted on is the real product.
- Warning and critical limits on each asset parameter
- Every reading classified as normal, warning or critical on arrival
- A projection of when the trend reaches the limit
Getting readings in
Use the readings you already have.
You do not need to replace your PLCs or buy a new sensor network to start. MaintenanceIQ takes readings from three places, and you can mix them on the same machine.
Readings stay in an append-only time series, so a value that was recorded is never quietly changed later.
Pushed from your control systems
A PLC, SCADA system or IoT gateway can push readings through a token-secured ingest API. Each machine's parameters receive their values as they are measured.
Imported from CSV or Excel
A wizard maps the columns in your file to the machine's parameters, with a live preview before anything is saved. It handles single-day files where only the clock time is recorded, an optional from and to window, and merged or blank rows. Choose a silent historical backfill or a live drop that alerts, and undo a whole import in one click if it was the wrong file.
Logged by hand on a round
Operators and technicians enter readings from a gauge, a handheld meter or a visual check. A manual round reading is judged against the same limits as one from a sensor.
Classify, alert, act
Condition monitoring that opens the work for you.
A reading that nobody acts on is just a number. In MaintenanceIQ each monitored parameter has a unit, a warning limit, a critical limit and a breach action. Each reading is judged the moment it is written.
A warning alerts the people scoped to that machine. A critical reading can open a breakdown on its own, and repeated critical readings do not open a pile of duplicates. From there, your team raises the linked corrective work order and the history stays traced to the reading that started it. This is condition-based maintenance in its plainest form: the machine's own readings decide when work happens.
- Warnings alert scoped users
- Critical readings can open a deduplicated breakdown
- Breakdowns link to the corrective work order and the asset history
- Sensor values can also drive usage-based PM meters
On the asset
See the trend, not just the last value.
The Monitoring tab on each asset is a logbook and an analysis view in one. A health banner sums up the machine. Each parameter card shows a sparkline, its statistics, the trend, how fresh the data is and the drift-to-limit projection. Expand a card for a trend chart drawn against the warning and critical bands, with breach markers and the reading log beneath it.
The drift-to-limit projection is a straight line drawn through recent readings. It estimates when a parameter will reach its limit if it keeps moving at the same rate. It is not a black box. Statistics are worked out on the server across the whole date range you pick, at any reading cadence, so a long history is not cut down to the last few hundred points.
- Health banner and parameter cards
- Threshold-band trend chart with breach markers
- The full reading log, which cannot be edited
- Accurate statistics over the whole range
How the projection reads a drift
Worked example (illustrative)
Pump P-07's bearing vibration was 4.6 mm/s this morning and has risen by about 0.2 mm/s a day for the past week. The warning limit is 5.6 mm/s and the critical limit is 7.1 mm/s. These numbers are examples, not recommendations for your machine.
| Step | Arithmetic | Result |
|---|---|---|
| Gap to warning | 5.6 minus 4.6 | 1.0 mm/s |
| Days to warning | 1.0 / 0.2 | 5 days |
| Gap to critical | 7.1 minus 4.6 | 2.5 mm/s |
| Days to critical | 2.5 / 0.2 | 12.5 days |
At this rate the bearing reaches warning in about 5 days and critical in about 12 or 13 days. That is enough time to order the bearing and fit it in a planned stop.
Across the fleet
Know which machines need attention today.
Your reliability engineer should not have to open every asset to find the one in trouble.
Needs-attention ranking
The fleet view ranks monitored machines so the ones nearest trouble rise to the top.
How: Fleet insights on the condition monitoring page
Stale-sensor detection
A sensor that stops sending is flagged, so silence is never mistaken for health.
How: Staleness on every parameter
Asset Risk (Beta)
Predictive maintenance from your own data, no AI theatre. Condition drift is combined with breakdowns, PM status and criticality into an explainable risk score.
How: Included in the add-on
Learn moreVibration and more
Any parameter you can measure.
Vibration monitoring on bearings is the classic case, but a monitored parameter can be anything with a unit and a limit: temperature, pressure, current, flow, oil condition or a furnace reading. MaintenanceIQ trends the values your sensors and rounds send. Detailed spectrum analysis stays with your analyst's own tools, and the result of that work can be logged as a reading or a note on the asset.
Related reading
- Asset Risk (Beta)Explainable risk per asset, built on these readings.
- Breakdown and downtime trackingWhat happens after a critical reading opens a breakdown.
- Preventive maintenance softwareUsage-based PMs driven by sensor meters.
- MTBF and MTTR reliability analyticsHow fewer surprise failures show up in the numbers.
Frequently asked questions
Do we need new sensors to start?
No. You can start with readings your team already takes on rounds, with files exported from your existing systems, or with values your PLC, SCADA or IoT gateway already produces. Readings can be entered by hand, imported from CSV or Excel, or pushed through the token-secured ingest API.
Does MaintenanceIQ predict failures?
It projects, in a straight line, when a parameter will reach its limit if the current trend continues, and it alerts when limits are crossed. Asset Risk (Beta) adds an explainable risk score built from your own records, and opens a draft preventive work order for machines likely to struggle, which your planner accepts or dismisses. Nothing is hidden in a black box.
What happens when a reading goes critical?
The reading is classified as critical the moment it is written, and the parameter's breach action can open a breakdown on its own. Repeated critical readings do not open duplicate breakdowns.
Is condition monitoring included in Core CMMS?
No. It is a licensed add-on. It is included automatically with the Foundry & Metals package, and the free trial includes it when you pick Foundry at signup.